[Tkinter Gui 教程08] Canvas 图形绘制
已获原作者授权. 原系列地址: Python Tkinter
简介
Canvas 为 Tkinter 提供了绘图功能. 其提供的图形组件包括 线形, 圆形, 图片, 甚至其他控件. Canvas 控件为绘制图形图表, 编辑图形, 自定义控件提供了可能.
在第一个例子里, 我们将演示如何画一条直线. create_line(coords, options) 方法用来绘制一条直线. coords 为以整形表示的四个坐标参数: x1, y1, x2, y2 . 这表示所要绘制的直线连接了 (x1, y1) 和 (x2, y2) 这两个点. 除坐标外, 该方法还接受其他可选的 options 参数. 在下面的例子里我们用 options 参数指定颜色为我们网站的主题色: fill=#476042 .
因为是第一个例子, 所以我们尽量做了简化: 创建一个 canvas 对象然后在其上绘制一条水平直线. 这条直线将 canvas 分割为上下两部分.
在传入坐标参数时, y = int(canvas_height / 2) 这种强制转换整形的表达式是没有必要的, 因为 create_line() 方法也接受 float 类型作为坐标参数, float 坐标数值将被自动转为整形. 下面是第一个例子的代码:
from tkinter import *
master = Tk()

canvas_width = 80
canvas_height = 40
w = Canvas(master,
           width=canvas_width,
           height=canvas_height)
w.pack()

y = int(canvas_height / 2)
w.create_line(0, y, canvas_width, y, fill="#476042")

mainloop()
上述代码在 Python3 下会有如下显示:

使用 create_rectangle(coords, options) 方法可以绘制矩形. coords 参数依然表示两个点的坐标: 第一个点为左上角坐标, 第二个点为右下角坐标.
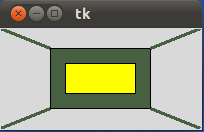
上面的窗口是由以下示例代码生成的:
from tkinter import *

master = Tk()

w = Canvas(master, width=200, height=100)
w.pack()

w.create_rectangle(50, 20, 150, 80, fill="#476042")
w.create_rectangle(65, 35, 135, 65, fill="yellow")
w.create_line(0, 0, 50, 20, fill="#476042", width=3)
w.create_line(0, 100, 50, 80, fill="#476042", width=3)
w.create_line(150,20, 200, 0, fill="#476042", width=3)
w.create_line(150, 80, 200, 100, fill="#476042", width=3)

mainloop()
下图阐释了上面两个例子中 create_lines() 和 create_rectangle() 这两个方法中, 用到的各个坐标的含义:

绘制文字
接下来我们将说明如何在 canvas 上绘制文字. 我们将直接修改上面的例子以作为新的示例. create_text() 方法用来在 canvas 上绘制文字. 该方法的头两个参数表示所要绘制的文字的坐标. 默认情况下, 文字将以此坐标为中心进行绘制. 当然, 你也可以复写 anchor 属性来改变文字绘制的对齐方式. 比如, anchor = NW 即为指定该点坐标为所绘文字的左上角. text 属性用以指定具体绘制在 canvas 上的文字.
from tkinter import *

canvas_width = 200
canvas_height = 100

colours = ("#476042", "yellow")
box=[]

for ratio in ( 0.2, 0.35 ):
   box.append( (canvas_width * ratio,
                canvas_height * ratio,
                canvas_width * (1 - ratio),
                canvas_height * (1 - ratio) ) )

master = Tk()

w = Canvas(master,
           width=canvas_width,
           height=canvas_height)
w.pack()

for i in range(2):
    w.create_rectangle(box[i][0], box[i][1],box[i][2],box[i][3], fill=colours[i])

w.create_line(0, 0,                 # canvas 原点
              box[0][0], box[0][1], # box[0] 的左上角坐标
              fill=colours[0],
              width=3)
w.create_line(0, canvas_height,     # canvas 的左下角坐标
              box[0][0], box[0][3], # box[0] 的左下角坐标
              fill=colours[0],
              width=3)
w.create_line(box[0][2],box[0][1],  # box[0] 的右上角坐标
              canvas_width, 0,      # canvas 的右上角坐标
              fill=colours[0],
              width=3)
w.create_line(box[0][2], box[0][3], # box[0] 的右下角坐标
              canvas_width, canvas_height, # canvas 的右下角坐标
              fill=colours[0], width=3)

w.create_text(canvas_width / 2,
              canvas_height / 2,
              text="Python")
mainloop()
虽然从代码上来看, 我们对之前的例子做了很大的改动, 但其所输出的结果却与前例相差不大, 仅仅在窗口的中间多了一个显示 "Python" 字样的方框:

本例中我们改用变量存储坐标等参数, 这使得改动变的方便. 比如, 要将整个画布的宽高设为 90 * 190, 将 box[0] 的宽高比设为 0.3, 在本例中将很容易做到, 但在之前的例子中却要修改很多代码.
本例运行后显示如下窗口:

绘制 Oval
图形 oval 是一个蛋形的曲线. 它形似椭圆, 但并不是椭圆. 事实上, oval 这个概念没有太明确的定义. 很多不同的曲线都被叫做 oval, 他们都有如下共同点:
- 都是可微分的简单 (非自相交) 凸闭曲线
- 他们比椭圆曲线简单
- 至少有一条对称轴
oval 这个词源自拉丁语中的 ovum, 意为 "蛋", 这很好的描述了它: 一条描述蛋形状的曲线. 一个 oval 由两条半径不同的弧线组成. 下图是一个特殊的 oval:

我们可以使用如下方法在 canvas 中创建一个 oval:
id = C.create_oval ( x0, y0, x1, y1, option, ... )该方法的返回值为所创建的 oval 对象在当前 canvas 上的 ID.
下面的代码绘制了一个圆心在 (75, 75), 半径为 25 的正圆形:
from tkinter import *

canvas_width = 190
canvas_height =150

master = Tk()

w = Canvas(master,
           width=canvas_width,
           height=canvas_height)
w.pack()

w.create_oval(50,50,100,100)

mainloop()
我们可以定义一个专门用来画正圆形的方法:
def circle(canvas, x, y, r):
    id = canvas.create_oval(x-r, y-r, x+r, y+r)
    return id
交互式绘图
我们想要创建一个可在 canvas 上手动绘图的应用, 但 canvas 并未提供画单个点的方法. 我们可以通过绘制小的 oval 图形来解决这个问题:
from tkinter import *

canvas_width = 500
canvas_height = 150

def paint( event ):
   python_green = "#476042"
   x1, y1 = ( event.x - 1 ), ( event.y - 1 )
   x2, y2 = ( event.x + 1 ), ( event.y + 1 )
   w.create_oval( x1, y1, x2, y2, fill = python_green )

master = Tk()
master.title( "Painting using Ovals" )
w = Canvas(master,
           width=canvas_width,
           height=canvas_height)
w.pack(expand = YES, fill = BOTH)
w.bind( "<B1-Motion>", paint )

message = Label( master, text = "Press and Drag the mouse to draw" )
message.pack( side = BOTTOM )

mainloop()
绘制多边形
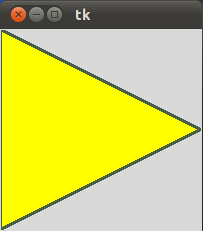
如果要绘制一个多边形, 可以使用 create_polygon(x0, y0, x1, y1, x2, y2, ...) 方法. 至少要传入三个点的坐标才可以绘制一个多边形.
下例用该方法绘制了一个三角形:
from tkinter import *

canvas_width = 200
canvas_height =200
python_green = "#476042"

master = Tk()

w = Canvas(master,
           width=canvas_width,
           height=canvas_height)
w.pack()

points = [0,0,canvas_width,canvas_height/2, 0, canvas_height]
w.create_polygon(points, outline=python_green,
            fill='yellow', width=3)

mainloop()
运行后显示为如下窗口:
或许你在读到这篇教程时圣诞节 马上就到了/为时尚早. 这里我们用 Python 和 Tkinter 做一些星星来装点我们的圣诞树. 第一课星星几乎没有用到任何编程技巧:
from tkinter import *

canvas_width = 200
canvas_height =200
python_green = "#476042"

master = Tk()

w = Canvas(master,
           width=canvas_width,
           height=canvas_height)
w.pack()

points = [100, 140, 110, 110, 140, 100, 110, 90, 100, 60, 90, 90, 60, 100, 90, 110]

w.create_polygon(points, outline=python_green,
            fill='yellow', width=3)

mainloop()
上例非常没有技术含量. 如果我们要改变星星的大小或胖瘦, 该怎么办? 上例中我们只能重新指定所有点的坐标, 这种做法乏味且易出错. 因此, 我们用了更多的编程技巧改造了上例. 首先, 我们将星星的绘制放在一个方法体中, 并用星星的原点及两个长度指定星星的具体形状:

经过改造的代码如下:
from tkinter import *

canvas_width = 400
canvas_height =400
python_green = "#476042"

def polygon_star(canvas, x,y,p,t, outline=python_green, fill='yellow', width = 1):
   points = []
   for i in (1,-1):
      points.extend((x,          y + i*p))
      points.extend((x + i*t, y + i*t))
      points.extend((x + i*p, y))
      points.extend((x + i*t, y - i * t))

   print(points)

   canvas.create_polygon(points, outline=outline,
                         fill=fill, width=width)

master = Tk()

w = Canvas(master,
           width=canvas_width,
           height=canvas_height)
w.pack()

p = 50
t = 15

nsteps = 10
step_x = int(canvas_width / nsteps)
step_y = int(canvas_height / nsteps)

for i in range(1, nsteps):
   polygon_star(w,i*step_x,i*step_y,p,t,outline='red',fill='gold', width=3)
   polygon_star(w,i*step_x,canvas_height - i*step_y,p,t,outline='red',fill='gold', width=3)

mainloop()
这个例子的运行结果更像一个X形. 很显然, 用逐个指定坐标点的方法绘制这个图形将无比麻烦.

绘制Bitmap
create_bitmap() 方法用来绘制 bitmap. 以下 bitmap 在所有平台上都可用:
"error", "gray75", "gray50", "gray25", "gray12", "hourglass", "info", "questhead", "question", "warning"
下例将这些 bitmap 全部都绘制在一个 canvas 上:
from tkinter import *

canvas_width = 300
canvas_height =80

master = Tk()
canvas = Canvas(master,
           width=canvas_width,
           height=canvas_height)
canvas.pack()

bitmaps = ["error", "gray75", "gray50", "gray25", "gray12", "hourglass", "info", "questhead", "question", "warning"]
nsteps = len(bitmaps)
step_x = int(canvas_width / nsteps)

for i in range(0, nsteps):
   canvas.create_bitmap((i+1)*step_x - step_x/2,50, bitmap=bitmaps[i])

mainloop()
结果如下:

绘制图片
使用 create_image(x0, x0, options ...) 用来在 canvas 上绘制图片. 该方法不能直接接受图片路径等作为参数, 而是接受一个 PhotoImage 对象作为图片参数. PhotoImage 类用于读取图片, 但其只能读取 GIF 和 PGM/PPM 格式的图片.
from tkinter import *

canvas_width = 300
canvas_height =300

master = Tk()

canvas = Canvas(master,
           width=canvas_width,
           height=canvas_height)
canvas.pack()

img = PhotoImage(file="rocks.ppm")
canvas.create_image(20,20, anchor=NW, image=img)

mainloop()
上面的代码运行后输出如下窗口:

小练习
编写一个方法绘制一个棋盘: checkered(canvas, line_distance), 其中: "canvas" 即 Canvas 对象, 棋盘在其上绘制; "line_distance" 为线间距.

代码如下:
from tkinter import *

def checkered(canvas, line_distance):
   # vertical lines at an interval of "line_distance" pixel
   for x in range(line_distance,canvas_width,line_distance):
      canvas.create_line(x, 0, x, canvas_height, fill="#476042")
   # horizontal lines at an interval of "line_distance" pixel
   for y in range(line_distance,canvas_height,line_distance):
      canvas.create_line(0, y, canvas_width, y, fill="#476042")


master = Tk()
canvas_width = 200
canvas_height = 100
w = Canvas(master,
           width=canvas_width,
           height=canvas_height)
w.pack()

checkered(w,10)

mainloop()
上面的代码运行后输出如下窗口:

相关tkinter 教程系列
- [Tkinter Gui 教程15] event 事件绑定
- [Tkinter Gui 教程14] menu 菜单
- [Tkinter Gui 教程13] Mastermind 游戏
- [Tkinter Gui 教程12] 布局管理 (Pack Place Grid)
- [Tkinter Gui 教程11] 对话框和消息框
- [Tkinter Gui 教程10] Text 控件
- [Tkinter Gui 教程09] Scale 控件
- [Tkinter Gui 教程08] Canvas 图形绘制
- [Tkinter Gui 教程07] Entry 控件
- [Tkinter Gui 教程06] Checkbox 控件
- [Tkinter Gui 教程05] Radiobutton 控件
- [Tkinter Gui 教程04] Variable 类
- [Tkinter Gui 教程03] Button 控件
- [Tkinter Gui 教程02] Message 控件
- [Tkinter Gui 教程01] 入门: Label 控件
原文地址:https://segmentfault.com/a/1190000014289907
布施恩德可便相知重
微信扫一扫打赏
支付宝扫一扫打赏